Iran war fuel prices: American consumers have paid an average of $471 more for fuel since the war on Iran began on February 28 — roughly eight times the global average of about $60 — according to a study of 169 countries published on Monday by the Finland-based Centre for Research on Energy and Clean Air (CREA). No country on earth is paying more at the pump for this war than the country that is fighting it.
Track it live: oil prices, live markets and the Iran war tracker.
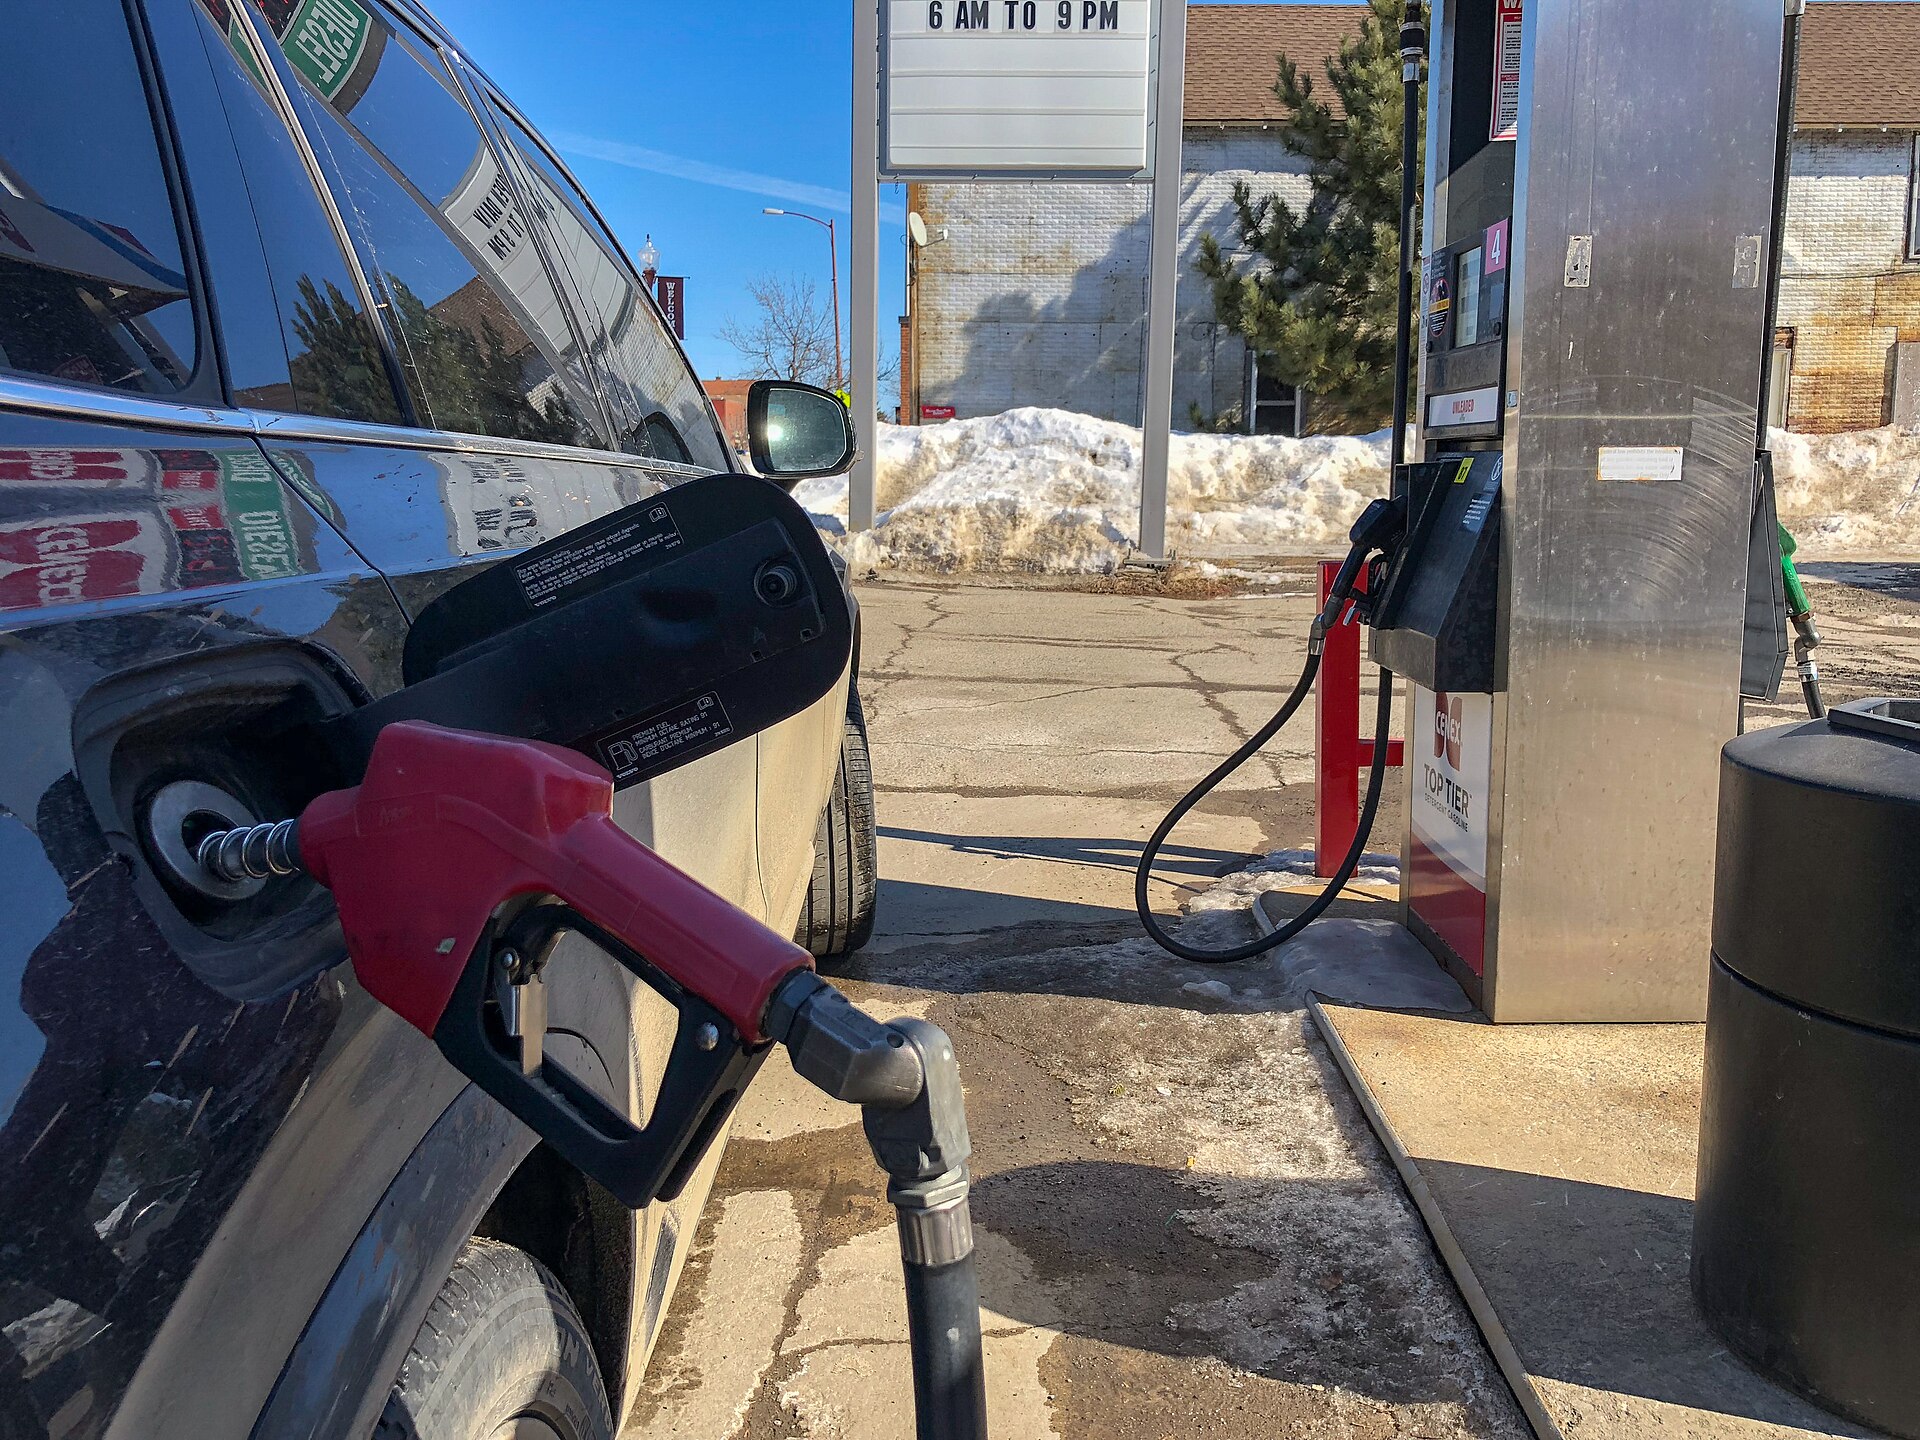
WASHINGTON, October 26, 2026 — The United States is paying more than any other country in the world for the jump in fuel prices caused by its own war on Iran, a study released on Monday found. The analysis, by the Finland-based nonprofit Centre for Research on Energy and Clean Air (CREA), put the average extra cost to an American consumer at $471 since the war started on February 28 — against an average of about $60 for consumers everywhere else. The mechanism is the one drivers have watched all year: the virtual shutting of the Strait of Hormuz in the war’s first phase, and the blockade that followed, choked the world’s most important oil chokepoint and pushed fuel prices up everywhere. But the bill, CREA found, did not land evenly. It landed hardest in America.
What the study found
CREA compared fuel prices in January and February of this year — the last two months before the war — with what consumers paid during the rest of the year, drawing on fuel price and consumption data from 169 countries from the beginning of March to mid-October. The global total is staggering on its own: the world has paid an additional $468 billion for fuel in that period. The distribution is the story. The United States accounts for $160 billion of that total — about 34 cents of every extra dollar the world has spent on fuel — followed by China at $54 billion and Canada at $17 billion. In per-person terms the gap is wider still: the $471 average for an American consumer is nearly eight times the roughly $60 global average, and consumers in Canada, Australia, New Zealand and Belgium, the next hardest-hit group, also paid substantially more than the world norm without matching the American figure.
The comparison with China sharpens the point. China has more than four times the U.S. population and is the world’s largest oil importer, yet its consumers’ total extra bill — $54 billion — is a third of America’s. This is not, in other words, a simple story of big countries paying big totals. It is a story about how a country uses fuel, and on that measure the United States is in a class of its own.
Why Americans pay more: the efficiency gap
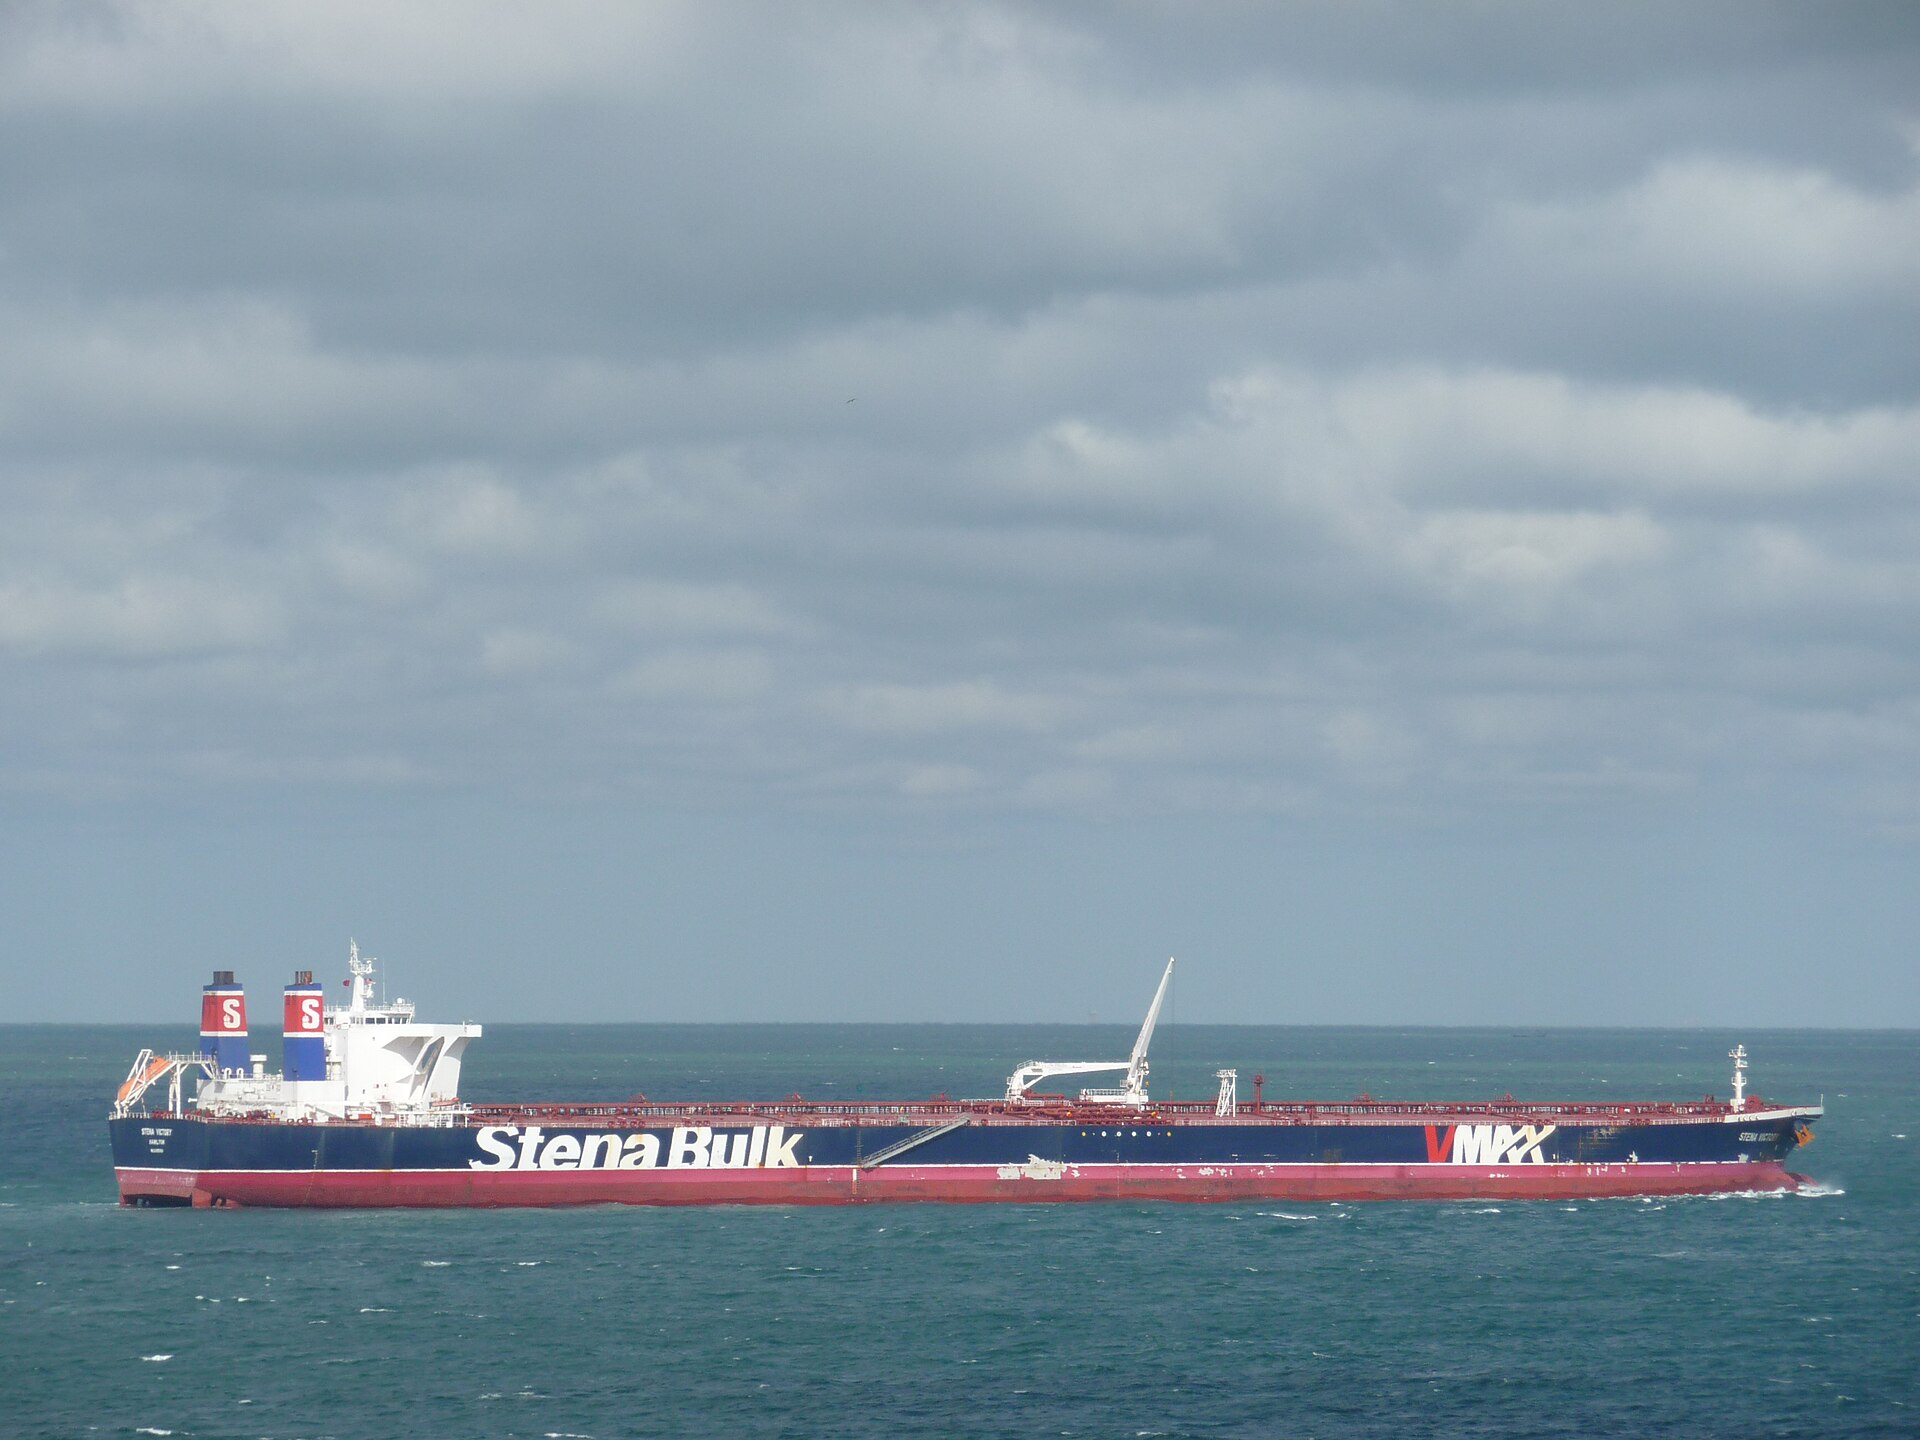
CREA’s explanation comes in three parts, and none of them is about the war itself. American consumers pay more, the study said, because of reliance on less efficient private vehicles, longer distances travelled, and a relatively slow transition to electric vehicles. Each factor multiplies the others. A price spike is a tax levied per gallon; a country whose fleet burns more gallons per mile, whose commuters drive more miles, and whose alternatives to driving are scarcer pays that tax at a higher rate than a country with smaller cars, shorter trips and trains or EVs to switch to. The war set the price. America’s transport system set America’s exposure to it.
That is also why the burden is so unevenly shared inside the United States, even though the study reports only a national average. $471 is a mean across very different lives: a rural driver covering long distances in a pickup pays far more; a city resident who takes transit pays almost nothing directly, though higher fuel costs reach them through delivery prices and airfares. Averages conceal that spread, and readers should hold the figure for what it is — the clearest available measure of the war’s pump-price cost per person, not a receipt any individual driver can check against their own year.
Why this matters
Wars are usually priced in budgets: appropriations, munitions, deployments. This study prices one in household terms, and the number it produces — $471 a person, $160 billion in total — is the kind that reorganises politics. Fuel prices are the most visible price in American life, posted on signs drivers pass every day, and they have a long record of moving voters’ judgement of an administration whether or not the administration controls them. Reuters noted in reporting the study that high energy prices are a sensitive issue for the Trump administration amid its war on Iran, with midterm elections approaching next month. A finding that Americans are paying the world’s highest war premium at the pump, published a week before those elections, lands in the middle of that sensitivity.
It also reframes the strategic argument. The case for the war, as the administration makes it, is about Iran’s nuclear programme — a security benefit that is real but abstract and shared with allies. The cost measured by CREA is concrete, domestic and unshared: the country bearing the largest financial burden of the fuel disruption is not Iran’s neighbours, not Europe, not Asia’s big importers, but the United States itself. Whether that trade is worth making is a political question. What the study settles is who is paying for it.
Background: from the Hormuz closure to the American pump
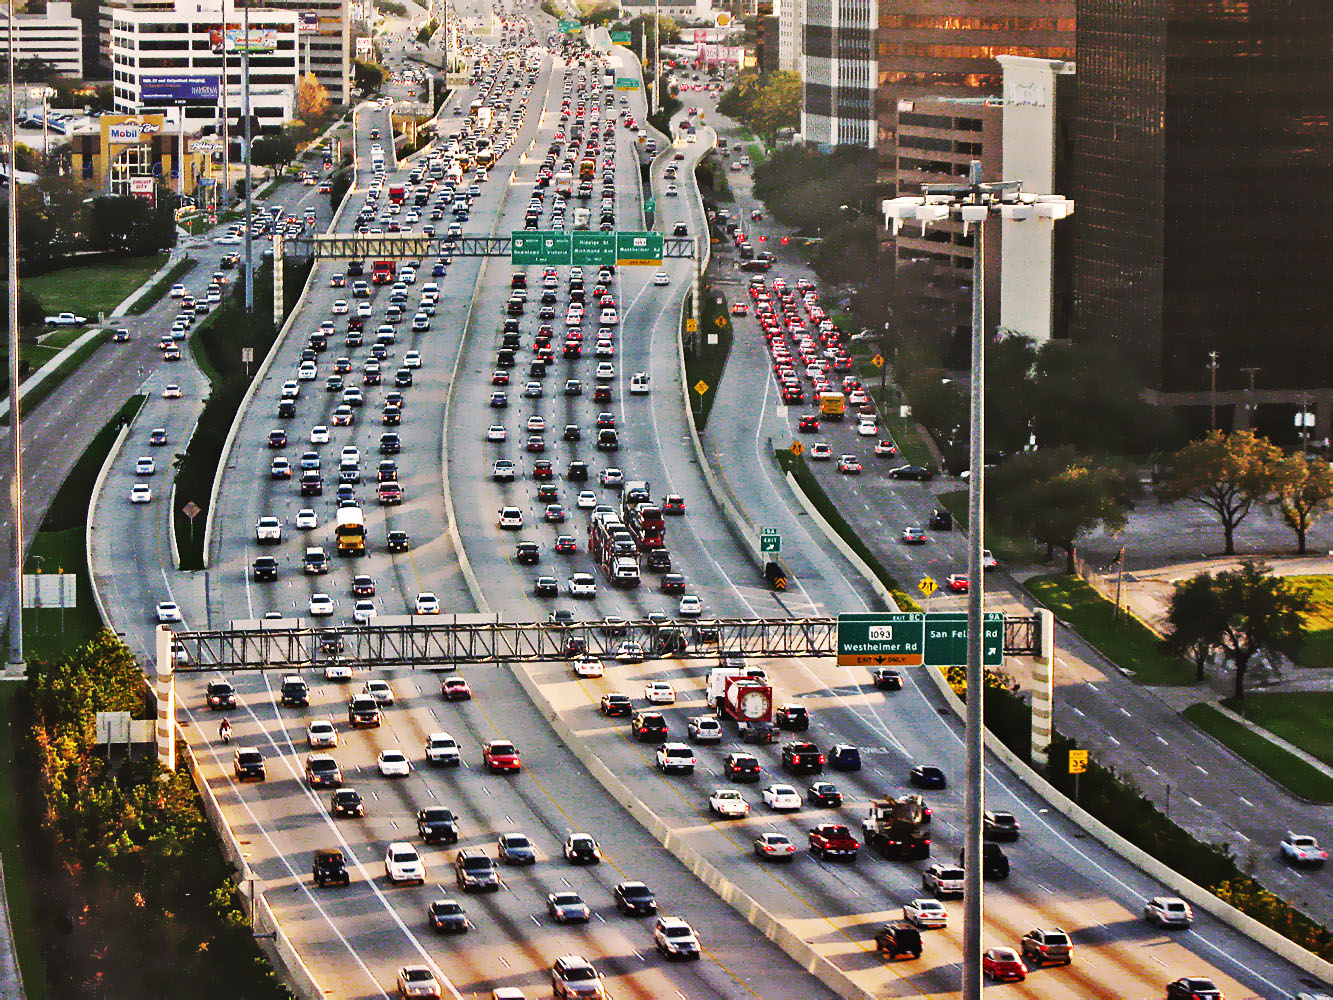
The chain from the first strikes to Monday’s study runs through the Strait of Hormuz, the narrow waterway between Iran and Oman through which a large share of the world’s traded oil and liquefied natural gas normally passes. The war that began on February 28 led to the strait’s virtual shutting and then a blockade, and the resulting supply disruption pushed crude and refined-fuel prices up worldwide — a transmission we traced in October in our analysis of why Iran war gas prices reached $4.41 a gallon. What is new in CREA’s work is not the direction of that chain but its measurement: putting a per-person dollar figure on each country converts a familiar complaint — fuel costs more because of the war — into a comparison, and the comparison is unflattering to the assumption that distance from the fighting means distance from its costs.
There is a second transmission worth naming, because it cuts against any simple relief narrative. Even if crude prices ease, refined products — gasoline and diesel — respond to refinery capacity, shipping costs and regional shortages as well as to the oil price itself. American drivers learned that asymmetry in earlier price shocks: pump prices rise fast on supply fear and fall slowly on supply relief. The administration’s promise that prices will fall when the war ends may prove right about direction while still leaving months of elevated costs in the meantime — months CREA’s method would keep adding to the $471.
The administration’s case, the critics, and a caveat about the source
The Trump administration’s answer to the study is already on the record: higher fuel prices are a small cost for consumers to pay to stop Iran from getting nuclear weapons, and oil and fuel prices will fall when the war ends. On that view, $471 is the price of preventing a far costlier outcome — a nuclear-armed Iran — and it is temporary by construction. The administration can also note that the war’s critics predicted economic damage in many forms that have been unevenly borne, and that American energy production remains the world’s largest, cushioning the country in ways import-dependent states cannot match.
Critics answer on two levels. The first is duration: the war has lasted longer than the administration predicted, and a temporary cost that renews every month stops behaving like a temporary cost — at the study’s run rate, each additional month adds tens of dollars to the average American’s bill. The second is distribution: the security benefit of the war is claimed for the whole alliance, but CREA’s figures show the fuel cost concentrated in the United States at nearly eight times the world average, which is an odd shape for a burden that allies are supposedly sharing.
One caveat belongs in plain sight. CREA is a research organisation that supports efforts to move the world off fossil fuels; it has a viewpoint, and its framing — measuring a war through fuel costs — reflects it. Its method is nonetheless transparent and replicable: prices before the war against prices after it, across 169 countries, using consumption to weight the totals. The figures were reported by Reuters, and no official body had published a competing per-country accounting as of Monday. Readers should treat $471 as a well-documented estimate from an interested source, not as a government statistic — and should also note that no critic has yet produced a number that contradicts its central finding.
What happens next
Three things will decide whether $471 is the final figure or merely the current one. The first is the war itself: every month it continues adds to the total, and the administration’s own case rests on prices falling when it ends — a testable promise, on a timeline voters can watch at every gas station in the country. The second is the midterm elections next month, where fuel prices give the war a household metric that no battlefield report can match; we have already seen the politics surface inside the president’s own coalition, in the debate we covered over what the administration knew about energy prices before the war. The third is slower and structural: the efficiency gap CREA identified — vehicle efficiency, driving distances, the pace of the electric transition — will still be there for the next supply shock, whoever is president and wherever it starts. Monday’s study is about this war. The exposure it measures is permanent until something changes it.
Sources
- Reuters, October 26, 2026 (Timothy Gardner, Washington): US consumers paying the most for fuel price spikes from the Iran war — the $471 average against about $60 worldwide, the $468 billion global total (US $160 billion, China $54 billion, Canada $17 billion), the 169-country scope and March to mid-October window, CREA’s efficiency/distance/EV explanation, and the administration’s position that higher prices are a small cost to stop Iran obtaining nuclear weapons and will fall when the war ends.
- IndexBox summary of the CREA study, October 26, 2026: independent restatement of the study’s findings, method and country comparisons.
- Centre for Research on Energy and Clean Air (CREA), study released October 26, 2026: fuel price and consumption analysis across 169 countries comparing January–February 2026 prices with the rest of the year.