Economy
Economy / Markets — The U.S. economy grew at a 3.4% annual rate in the third quarter — the fastest pace in a year and stronger than economists forecast — powered by an AI-driven investment boom, a government-spending rebound and a consumer who keeps spending. But the same morning brought the other half of the story: September inflation rose to 3.6%, real take-home pay fell, and the saving rate sank to its lowest in nearly four years. Released five days before the midterms, the BEA report is the last major economic snapshot voters will get.
Track it live: https://signalpostnews.com/tracker/markets

The last big number before the election is a good one — and a complicated one. The U.S. economy expanded at a 3.4 percent annual rate in the third quarter of 2026, the Commerce Department’s Bureau of Economic Analysis reported on Thursday, accelerating from 2.2 percent in the second quarter and posting the fastest pace of growth in more than a year. The advance estimate for July through September beat the consensus forecast of roughly 3.0 to 3.2 percent, and it arrived with an engine room that flatters the headline: business investment surged, consumer spending stayed strong, government spending rebounded, and the measure economists watch most closely for underlying private demand — real final sales to private domestic purchasers — rose 4.9 percent, even faster than the quarter before.
Yet the second report on the same government release schedule told the story households actually live. September inflation, measured by the personal consumption expenditures price index the Federal Reserve watches most closely, rose to 3.6 percent from a year earlier, a four-month high and further above the Fed’s 2 percent target. Americans spent more in September but gained nothing after inflation; real disposable income fell 0.3 percent; and the personal saving rate slid to 3.8 percent, the lowest in nearly four years. Growth, in other words, is being financed partly out of shrinking cushions.
Both halves of Thursday’s data land five days before the November 3 midterm elections, which will decide control of Congress, and one day after the Federal Reserve held interest rates steady in a divided vote in which two officials wanted a hike. There will be no bigger economic release before voters finish deciding. What follows is what the numbers say, what is driving them, where they conflict, and what they set up for the Fed’s December meeting and the BEA’s second estimate on November 25.
The headline: 3.4 percent, and a beat on every forecast that mattered
Gross domestic product is the broadest scorecard of the economy — the total value of goods and services produced in the United States — and the third quarter’s 3.4 percent annualized increase is, by recent standards, a strong print. It is up more than a full point from the second quarter’s 2.2 percent, it is the fastest pace since the third quarter of 2025, and it cleared a consensus that had clustered around 3.0 percent in CNN’s survey and 3.2 percent in the Reuters poll of economists. Forecasters were not caught out by a rounding error; the economy genuinely outran the professional expectation.
The BEA’s own accounting of the acceleration is specific. The increase in real GDP reflected increases in investment, consumer spending and government spending, partly offset by a decrease in exports, while imports — which subtract from GDP in the national accounts — increased. Compared with the second quarter, the bureau said, the pickup mainly reflected an acceleration in investment and an upturn in government spending. Strip out the volatile pieces — trade, inventories and government — and the core was stronger still: real final sales to private domestic purchasers, the sum of consumer spending and private fixed investment, rose 4.9 percent at an annual rate, up from 4.6 percent in the second quarter. That is not the signature of an economy rolling over; it is the signature of private demand expanding at close to twice its long-run trend.
Two cautions belong with the headline, and both are structural rather than partisan. First, this is an advance estimate, built on incomplete source data; the BEA will revise it on November 25 and again after that, and third-quarter prints have a history of moving. Second, GDP is an average of a very unequal economy — a point Thursday’s household data makes forcefully, and to which this article returns below.
The AI boom is now a macroeconomic force
The single most striking line in the report is investment. Business investment grew at a 12.7 percent annual rate in the third quarter, accelerating from 9 percent in the second, and within it, investment in information-processing equipment surged — the statistical fingerprint of the data-centre buildout that has spread across the country as technology companies race to add computing capacity for artificial intelligence. Construction of the buildings, the servers and networking gear that fill them, and the electrical equipment that powers them now register not as a sector story but as a measurable share of national growth.

That has two consequences worth separating. The first is arithmetic: capital spending on this scale props up GDP even when households pull back, which is one reason repeated predictions of a consumer-led slowdown have kept failing in 2026. The second is a question the GDP report cannot answer: how much of this investment ultimately pays for itself in productivity and output, and how much is a land-grab that later gets written down. For now, the spending is real, the cranes are up, and the contribution to growth is in the official data. Fitch Ratings economist Olu Sonola, quoted by CNN, put the quarter’s two engines in one sentence: “The AI boom and the irrepressible American consumer are keeping the economy from cooling.”
The consumer is still carrying the economy — unevenly
Consumer spending rose at a 3.8 percent annual rate in the third quarter. Because household consumption accounts for more than two-thirds of U.S. GDP, that figure, more than any other, explains why the economy keeps beating forecasts built on the assumption that squeezed households must eventually stop spending. Through higher prices, a softening hiring market and a year of geopolitical shocks, they have not stopped.
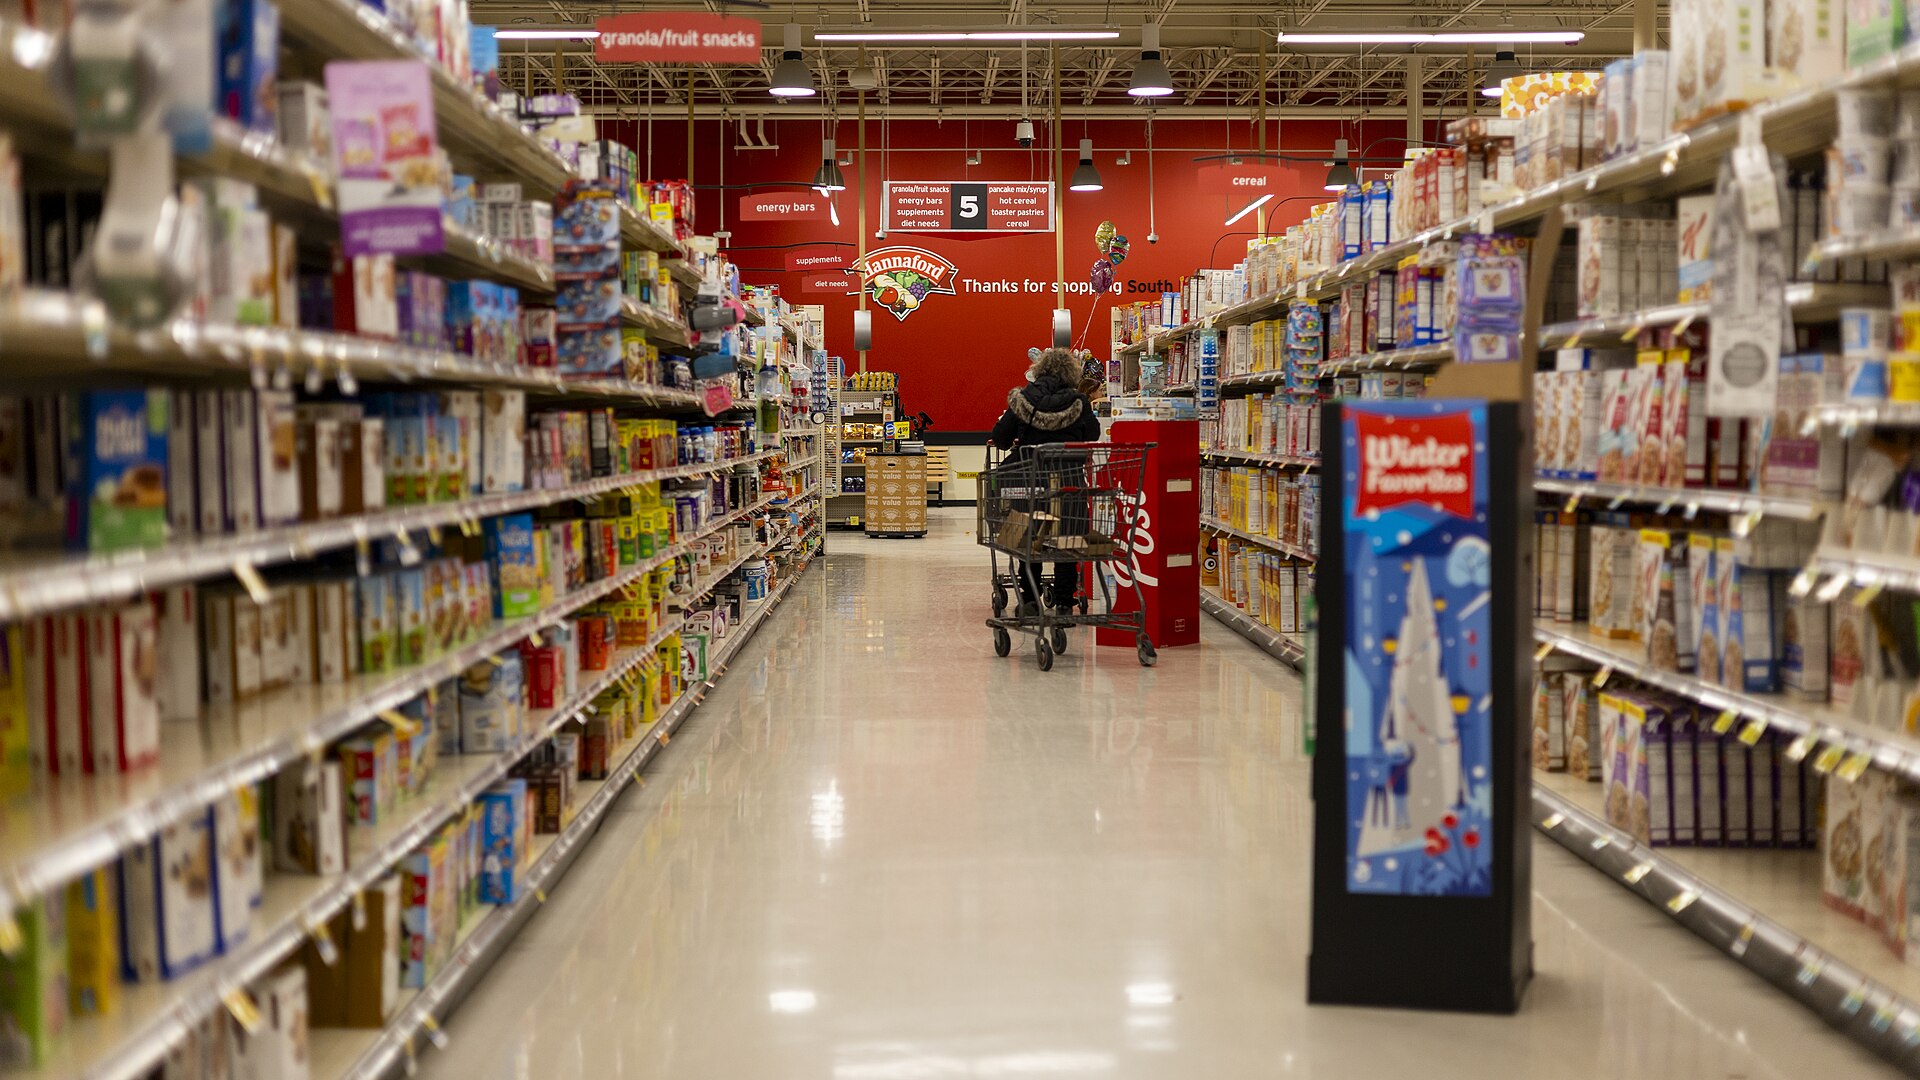
The distribution, though, is the story inside the story. NPR’s reporting on Thursday’s release found the growth driven disproportionately by higher-income consumers, who are better able to withstand stubbornly high inflation, while wage growth has fallen behind inflation for households further down the ladder. Economist Elizabeth Renter made the same point to CNN: the aggregate consumer strength in the data “is not uniform across households.” NPR illustrated the squeeze through Siri Steven, a resale-store manager in Decorah, Iowa, who described putting off repairs to her family’s more-than-130-year-old house: “We barely go out to eat now. I really have to be mindful of our budget and make sure that we can pay all our bills and not overdraft.” Both pictures are accurate at once — a national accounts aggregate can be strong precisely because the households doing most of the spending are the ones inflation hurts least.
The trade drag: exports down, imports up nearly 20 percent
Trade was the quarter’s counterweight. Exports fell 5.7 percent at an annual rate, while imports surged nearly 20 percent annualized — a combination that mechanically subtracts from GDP, because imports count against domestic production in the accounts even when they reflect strong American demand. CNN attributed the import surge in part to stockpiling ahead of Canadian tariffs and to purchases tied to the same data-centre buildout that lifted investment: servers and equipment bought from abroad raise investment and imports at the same time, washing part of the AI boom out of the headline number.
That accounting quirk matters for how to read 3.4 percent. The trade drag means the headline understates the strength of domestic demand in the third quarter — which is exactly what the 4.9 percent rise in real final sales to private domestic purchasers is designed to show. An economy importing at a near-20 percent pace is not an economy whose buyers have gone home; it is an economy whose buyers are sourcing more of what they buy from overseas, with the longer-run questions about tariffs, supply chains and the trade balance that follow from that.
The same morning’s other report: inflation at 3.6 percent
At the same 8:30 a.m. Eastern release moment, the BEA’s Personal Income and Outlays report for September delivered the counterweight. The PCE price index rose 0.5 percent in September from August and 3.6 percent from a year earlier — up from 3.4 percent year over year in August, a four-month high, and further above the Federal Reserve’s 2 percent target. Core PCE inflation, excluding food and energy, rose 0.3 percent on the month and 3.1 percent on the year, up from 3.0 percent. For a central bank that held rates steady the day before partly on the argument that it needs more evidence, September’s evidence points the wrong way: inflation is not merely stuck above target, on the Fed’s preferred gauge it re-accelerated.
A hot September inside a cooler quarter
There is an apparent contradiction in Thursday’s data that resolves on inspection. The GDP report’s own quarterly price gauges cooled sharply: the PCE price index rose at only a 2.1 percent annual rate across the third quarter as a whole, down from 5.0 percent in the second quarter, and the core quarterly gauge slowed to 2.5 percent from 3.3 percent. Both things are true because they measure different things — the quarterly figures average July, August and September against the spring, while the monthly figure shows where the quarter ended. The trajectory inside the quarter was upward, finishing at 3.6 percent year over year. Policymakers deciding policy in December will care less about the quarterly average than about that exit velocity.
The household ledger underneath the headline
September’s household detail explains why a 3.4 percent growth print can coexist with the gloomy consumer sentiment pollsters keep recording. Consumer spending rose 0.5 percent in September in dollar terms but was flat after adjusting for inflation — households ran faster to stand still. Personal income rose just 0.2 percent, and real disposable income — what households actually have left to spend or save after taxes and inflation — fell 0.3 percent. The personal saving rate dropped to 3.8 percent, down from 4.1 percent in August and the lowest in nearly four years, which means part of the quarter’s celebrated consumption was funded by saving less rather than earning more.
That is a financing model with a shelf life. Spending sustained by higher-income households and by a falling saving rate can continue for a long time — forecasters have been predicting its exhaustion all year — but it is more fragile than spending sustained by real income growth, because it depends on asset values, credit availability and confidence holding up simultaneously. Moody’s Analytics chief economist Mark Zandi captured the tension in comments carried by NPR: the economy is growing and moving forward, “but it’s a very, very fragile growth.” Thursday’s reports are the statistical version of that sentence: strong at the top line, thin at the margin.
The Fed’s December problem just got harder
The Federal Reserve could hardly have designed a data release less convenient for a quiet December. On Wednesday, policymakers held the federal funds rate steady at 3.75 to 4.00 percent in a 10–2 vote, with two officials preferring a hike — the subject of this newsroom’s report on the Fed’s divided decision and the December hike question. Chair Kevin Warsh described economic activity as expanding at a strong pace, with productivity strong and capital investment robust. Thursday’s GDP report ratifies that description almost word for word — and then September’s 3.6 percent inflation print hands the committee’s hawks their argument.
Sonola of Fitch stated the implication bluntly to CNN: “If the Fed needed another reason to hike in December, this report just gave it one.” The logic is difficult to escape. Central banks cut rates into weakness and raise them into overheating; a 3.4 percent growth quarter with 4.9 percent private domestic demand growth and re-accelerating inflation is, on the textbook, the second case. The counter-argument is equally visible in Thursday’s data: real disposable income is falling, the saving rate is at a near-four-year low, and the consumers carrying the expansion are increasingly the affluent few. A December hike would be a bet that the inflation risk outweighs the fragility — and it would land six weeks after a midterm election fought substantially over the cost of living.
The last snapshot before the midterms
The political calendar is what turns a strong statistical release into a campaign event. Thursday’s report is the last major read on the economy before the November 3 midterms: the final jobs report of the cycle, showing just 29,000 new jobs in September, came at the start of October — see this newsroom’s analysis of the September jobs report and the midterm economy — and no further GDP or PCE release will arrive before polls close. Both campaigns therefore have to fight over the same fixed set of numbers, and Thursday’s pair of reports hands each side its preferred half.
The case for the administration writes itself: growth beat forecasts, hit its fastest pace in a year, investment is booming and the economy conspicuously failed to tip into the recession so often predicted for it. The opposition’s case is in the same release package: inflation at 3.6 percent and rising, take-home pay falling in real terms, savings at a four-year low and a central bank openly split over whether to raise rates into the squeeze. The statistical reality is that both descriptions are accurate measurements of the same economy, taken at different altitudes — the national accounts at cruising height, the household ledger at ground level. Which altitude voters judge from is, in large part, what Tuesday decides.
Why this matters
For the Federal Reserve, the burden of proof has shifted
Before Thursday, a December rate hike was the position of a two-member minority. After Thursday, holding steady requires the majority to argue that 3.6 percent inflation is a blip inside a cooling quarter, against the monthly data’s direction of travel. The GDP report’s quarterly price gauges give them that argument; September’s monthly print takes much of it back. Expect the December meeting to be priced and debated as a genuinely live decision, with the November PCE report — arriving in between — cast as the tiebreaker.
For households, growth and the squeeze are the same fact
The defining feature of the late-2026 economy is the divergence Thursday quantified: output growing at 3.4 percent while real disposable income falls and the saving rate touches a four-year low. That divergence is why aggregate statistics and lived experience keep producing opposite verdicts on the same economy, and why “the economy is strong” and “the economy is failing families” can both poll as majority beliefs. Until real income growth, rather than spending, becomes the expansion’s engine, the divergence — and the political volatility it produces — will persist whichever party holds Congress.
For the AI buildout, the national accounts are now watching
When a single investment category — information-processing equipment for data centres — can visibly move the growth rate of a $30 trillion economy, it stops being a technology story and becomes a macroeconomic exposure. The upside is in Thursday’s numbers: investment at 12.7 percent is doing work that consumer retrenchment would otherwise undo. The exposure is concentration: growth now leans on the capital budgets of a handful of technology companies and on the assumption that AI capacity earns its cost. A pause in that buildout would subtract from GDP as mechanically as its surge has added.
The data in context
Set side by side, the quarter’s comparisons frame the moment. Real GDP: 2.2 percent in the second quarter, 3.4 percent in the third — the fastest in over a year. Real final sales to private domestic purchasers: 4.6 percent, then 4.9 percent. Business investment: 9 percent, then 12.7 percent. The PCE price index on a quarterly basis: 5.0 percent, then 2.1 percent — cooling — while the same index on a monthly year-over-year basis went from 3.4 percent in August to 3.6 percent in September — heating. The economy accelerated and inflation, on the measure that ends the quarter, accelerated with it. That combination — strong growth plus sticky, rising inflation — is the precise configuration that historically pushes central banks to tighten, and it is why Thursday’s good news arrived with an edge.
What happens next
Three dates now govern this story. On November 3, voters render the verdict this report was always going to feed into, with no further major data to move them. On November 25, the BEA publishes its second estimate of third-quarter GDP, the first chance to learn whether 3.4 percent survives contact with more complete source data. And in December, the Federal Reserve meets with Thursday’s dilemma on the table: an economy growing at its fastest in a year, an inflation rate climbing away from target, and a household sector whose real income is shrinking beneath both. The scenarios branch cleanly. If November’s inflation data cools, the Fed can hold and let the expansion run; if it repeats September’s rise, the two officials who wanted a hike this week will not be a minority view for long. Thursday’s report did not settle that argument. It raised the stakes of every data point between now and December — and it closed the economic record on which the midterm elections will be judged.
Sources
- Bureau of Economic Analysis, October 29, 2026 — the advance estimate: real GDP up 3.4% annualized in Q3 2026 from 2.2% in Q2, the contributions of investment, consumer and government spending, the decline in exports, and real final sales to private domestic purchasers up 4.9%; second estimate scheduled November 25.
- Bureau of Economic Analysis, Personal Income and Outlays, September 2026 — headline PCE inflation up 0.5% on the month and 3.6% year over year, core up 0.3% and 3.1%, consumer spending up 0.5% but flat in real terms, personal income up 0.2%, real disposable income down 0.3% and the saving rate at 3.8%.
- CNN, October 29, 2026 — the 3.0% consensus, business investment up 12.7% and consumer spending up 3.8%, exports down 5.7% and imports up nearly 20%, and the comments of Fitch’s Olu Sonola and economist Elizabeth Renter.
- USA Today, October 29, 2026 — the beat against forecasts, Chair Kevin Warsh’s description of activity expanding at a strong pace with robust capital investment, and the December meeting context.
- NPR, October 29, 2026 (via NPR Illinois) — growth led by higher-income consumers better able to withstand inflation, wage growth behind inflation, Mark Zandi’s “very, very fragile growth” assessment, and the Decorah, Iowa household example.