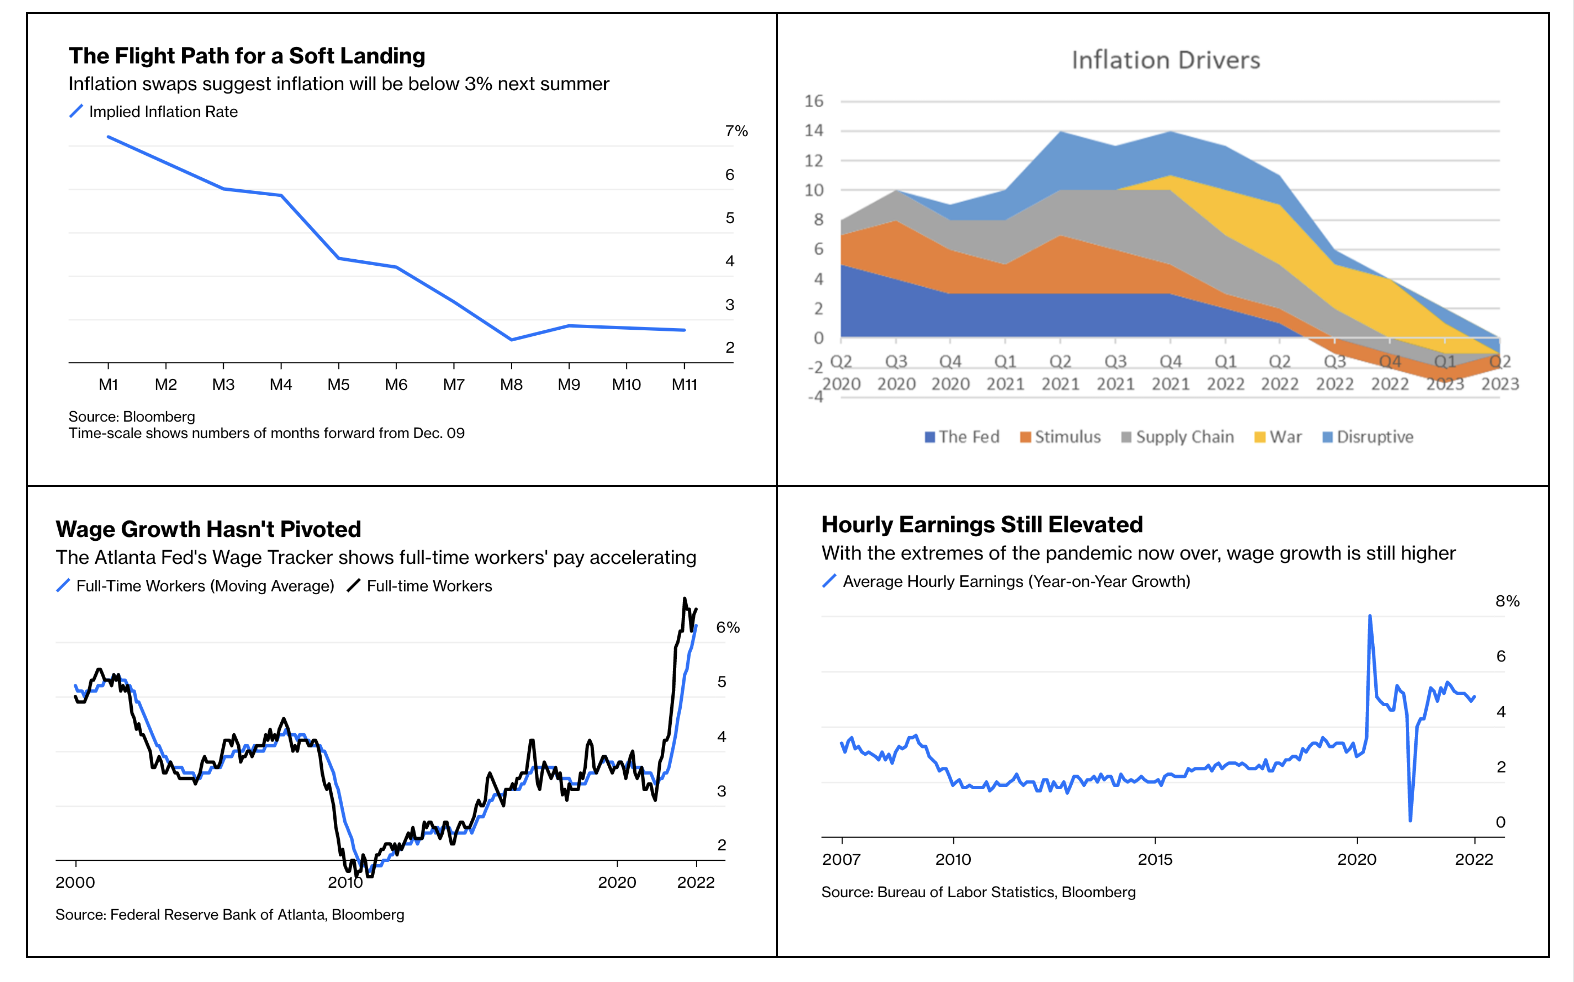

Economic news often arrives as a small set of headline numbers. The format is useful: complex activity needs summaries. But a summary becomes misleading when it is treated as a complete account of how people are doing.
Growth measures whether an economy is producing more, not how the gains are distributed or whether the activity improves daily life. Inflation tracks changes in a basket of prices, but no household buys the basket in exactly the same proportions. Employment counts can strengthen while job quality, hours, security or purchasing power move differently.
Ask who is inside the average
Whenever an average moves, look for the distribution beneath it. Results can vary by income, age, region, industry and housing situation. Falling overall inflation means prices are rising more slowly; it does not mean the earlier increases have been reversed. Rising wages may feel different for renters facing renewal than for homeowners with stable payments.
Time frames matter too. A monthly change can be volatile, while a yearly comparison may conceal a recent turn. Check whether a figure is adjusted for inflation, population growth or seasonal patterns. These details can change the interpretation without changing the underlying number.
Read the headline number, then ask who is inside the average.
Build a small dashboard, not a verdict
Good economic reading combines several lenses: output, prices, employment, wages, productivity, household debt and access to essentials such as housing and energy. The aim is not to find one perfect statistic, but to understand what each measure captures and what it leaves out.
Economic stories become clearer when national indicators are placed beside household experience without confusing one for the other. Data can show the direction and scale of change. Lived experience reveals how that change is distributed. A professional reading of the economy needs both.
Read inflation as a rate of change
Inflation measures how quickly prices are changing across a defined basket. If inflation falls from a high rate to a lower one, the price level is usually still rising, only more slowly. That distinction explains why official improvement can coexist with households feeling that groceries, rent or insurance remain expensive.
Look at both headline and underlying measures, then inspect the categories driving movement. Energy can be volatile; housing measures can respond with a lag; food prices matter greatly to households even when they are a smaller share of the full index. No single measure is dishonest, but each answers a different question.
Look beyond the unemployment rate
A low unemployment rate does not describe wages, hours, benefits or job security. Pair it with labor-force participation, payroll growth, job openings, involuntary part-time work and wage growth after inflation. The relationship among those measures can reveal whether workers have bargaining power or are accepting weaker conditions to stay employed.
Industry composition matters. Hiring in health care and government can offset weakness in manufacturing or technology, producing a stable headline while individual communities experience a very different market. Regional data and occupation-specific reporting often explain why national sentiment diverges from national averages.
Distinguish growth from living standards
Total economic output can rise because the population is larger, because people work more hours or because each hour produces more. Output per person and productivity help separate those stories. Even then, growth does not tell you how income is distributed, whether public services improved or whether environmental and social costs increased.
Household income should be read after taxes and inflation when possible. Wealth and income are different: a family may earn a solid salary while lacking savings, or have valuable housing equity but little monthly cash. Debt-service costs show how much interest rates are affecting available income.
Build a household-facing dashboard
For practical decisions, combine national economic indicators with numbers that affect your own budget: after-tax income, housing cost, essential spending, debt rates, emergency savings and major renewal dates. Update them quarterly rather than reacting to every headline. This creates a baseline for choices without pretending one household represents the country.
When borrowing, compare annual percentage rate, fees and total interest. When saving, compare yield, access and deposit insurance. When considering a job move, include benefits, commuting and schedule stability. The economy shapes these options, but a decision still depends on personal constraints and time horizon.
Use revisions and uncertainty
Economic releases are often revised as more information arrives. Treat the first estimate as a signal, not a final historical record. Surveys also have margins of error and response limitations. A professional explanation should identify those boundaries instead of presenting a decimal point as certainty.
Most important, avoid turning one month into a narrative. Compare several periods, look for confirmation across indicators and be explicit about what would change your view. Economic literacy is not prediction. It is the ability to update a judgment as better evidence appears.
Ask better questions of every release
When a new number appears, identify the source, period, adjustment and comparison point. Ask whether the change is broad or concentrated and whether earlier figures were revised. Then connect the measure to the decision under discussion. A national growth estimate may matter for public finance while offering little guidance on whether one household should buy a car.
Read commentary from analysts who show their assumptions and acknowledge uncertainty. Be wary of charts with truncated axes, isolated dates or labels that change the unit. When two credible interpretations differ, locate the premise that separates them rather than choosing the more confident voice.
Finally, preserve proportion. Economic indicators can shape borrowing, work and policy, but they do not dictate every personal choice. A stable emergency fund, manageable debt and decisions matched to a realistic horizon remain useful across many economic scenarios.
Why this matters
Inflation, unemployment and growth summarize an economy but do not describe any one household. Policy built around averages can look successful while housing, food or debt costs remain acute for particular groups. Reading the economy well means keeping the aggregate and the distribution in view at the same time.
How we got here
National accounts were designed to make vast economic activity comparable over time. Their strength is consistency; their weakness is compression. Earlier eras taught the same lesson: strong output can coexist with wage stagnation, and low unemployment can coexist with insecure work, because one indicator cannot carry the moral meaning assigned to “the economy.”
Who benefits, who loses and what critics say
Governments, businesses and investors benefit from common benchmarks. Households lose when those benchmarks are used to dismiss lived costs, while policymakers lose accuracy if anecdotes replace national evidence entirely. Critics of GDP are right that unpaid work and environmental damage sit poorly inside it; critics of anecdotal economics are right that personal hardship does not establish a nationwide trend.
What the comparison implies
Past-versus-present comparisons require the same definition, seasonality and inflation adjustment. A wage rising 4% while relevant prices rise 5% is a real loss despite a larger paycheck; a 3% average inflation rate can conceal faster increases in essentials. The implication is not that headline numbers are false, but that they answer narrower questions than public debate often assumes.
What happens next
The most useful economic reading will combine national trends with household-specific exposure: rent or mortgage status, debt structure, sector and region. If inflation cools while borrowing remains expensive, relief will arrive unevenly. Watch real wages, participation, housing costs and revisions—not only the first headline released each month.